As I mention in The R Guide, my method for building models in R is the product of some self-directed trial and error. It does not, therefore, match well with more conventional approaches to model building. It still works, and I still believe that “it works” is the only standard that really matters when it comes to code. However, the fact remains that my approach won’t play well with others. That is a weakness that I have been content to let sit for a while, but have finally decided to correct. So in a few simple steps, I’m going to walk you through the process I used to convert the R Guide model into a more standard form. For reasons, I am going to align with the method used by the DARTH Working Group.
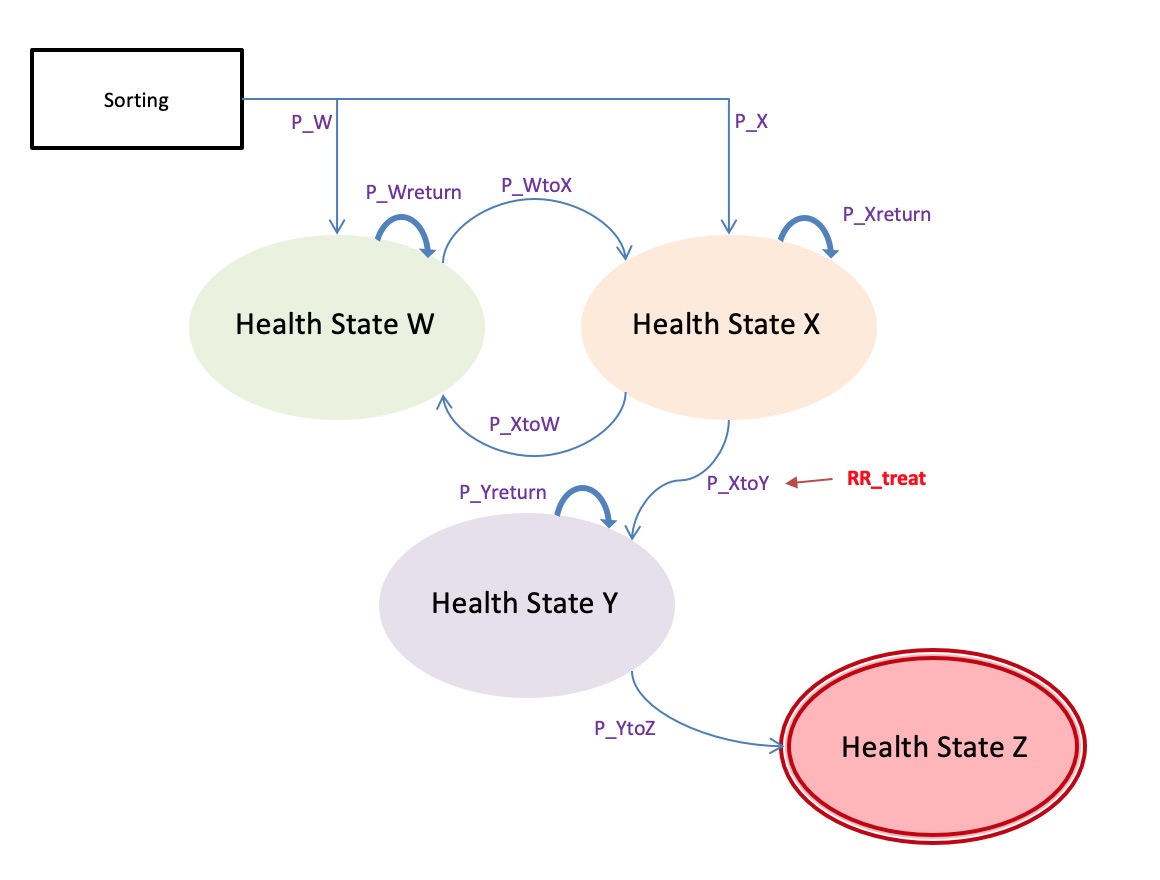
A quick refresher on our model, which I am going to call “The WXYZ Model”:
- It has 4 health states: W, X, Y, and Z. The cohort starts in either W or X.
- Cohort members can move back and forth between W and X, between X and Y, and between Y and Z. Z is an absorbing state.
- There are transition-related costs for states Y and Z that occur when someone enters the state, after which state costs are different.
- There is a treatment that modifies the risk of transition from X to Y.
We are going to build a program that runs the WXYZ model, both deterministically and probabilistically, using the DARTH approach. Luckily, I have some of the code for their “Sick, Sicker Model” I have adapted following three general steps:
Step 1: build functions
We are going to build three functions to make this model work. The first function will calculate all the parameter values we need to run the model, based on the inputs from our Excel table. The second function will take those parameter values and use them to construct the Markov matrix - the set of values that describe how the cohort moves between states in each cycle. The third function will generate the Markov trace - the cycle-by-cycle results as the cohort moves through the model for the length of the time horizon. We did all of this in the Guide, but in a notably different way.
Step 2: build a deterministic version of the WXYZ model
Next, we’re going to build a deterministic version of the WXYZ model. This itself will be made up of a series of steps: loading our necessary packages and functions, inputting our model parameters, defining and constructing our necessary matrices and vectors, running the actual model, and then computing the cost-effectiveness results.
Step 3: adapt the model to produce a probabilistic output
Once we have the model running deterministically, we are going to adapt the code so that it will run repeatedly over a user-defined number of simulated runs, with randomly-sampled parameter values for each run. We’ll look at a selection of useful probabilistic results.
The WXYZ Model
The full model code can be found here. It allows you to toggle between deterministic and probabilistic, and pulls all functions in from a file called ‘functions_WXYZ.R’.
The model asks the user to input controlling parameters:
- Location of ‘Model Inputs.xls’ (or whatever your Excel inputs file is called)
- Number of probabilistic simulations
- Number of cycles
- Societal WTP (lambda)
- Discounting rates for costs/effects
- Strategy Names
From there, all model results should be push-button simple to run. The following will be returned:
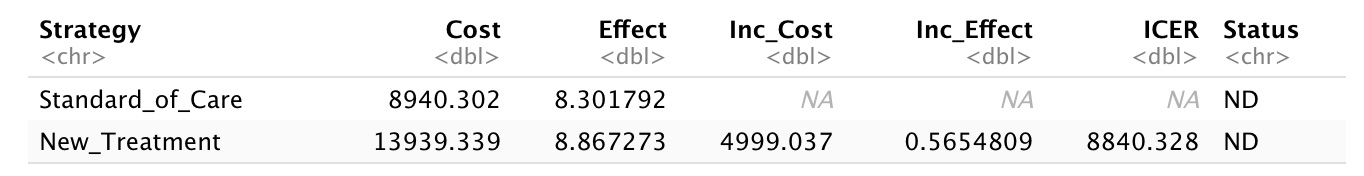
- A table of costs and QALYs for each arm, incremental costs and QALYs between arms, and the mean ICER
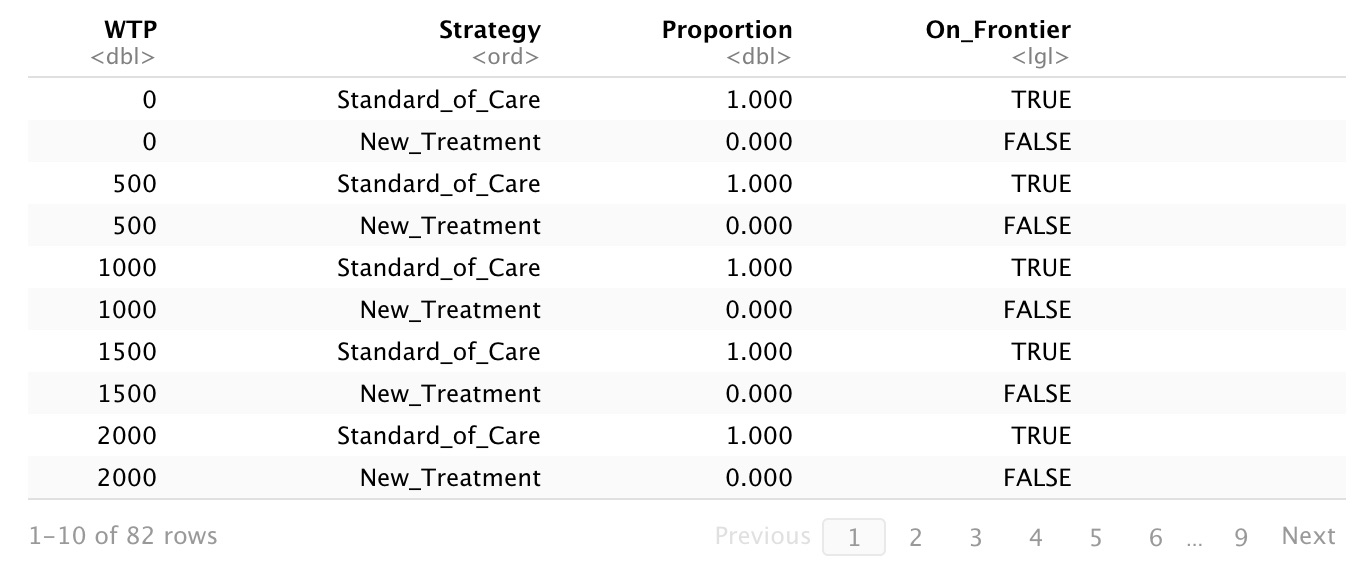
- Cost-effectiveness at different levels of WTP
- The percent probability that the new treatment is cost-effective at lambda
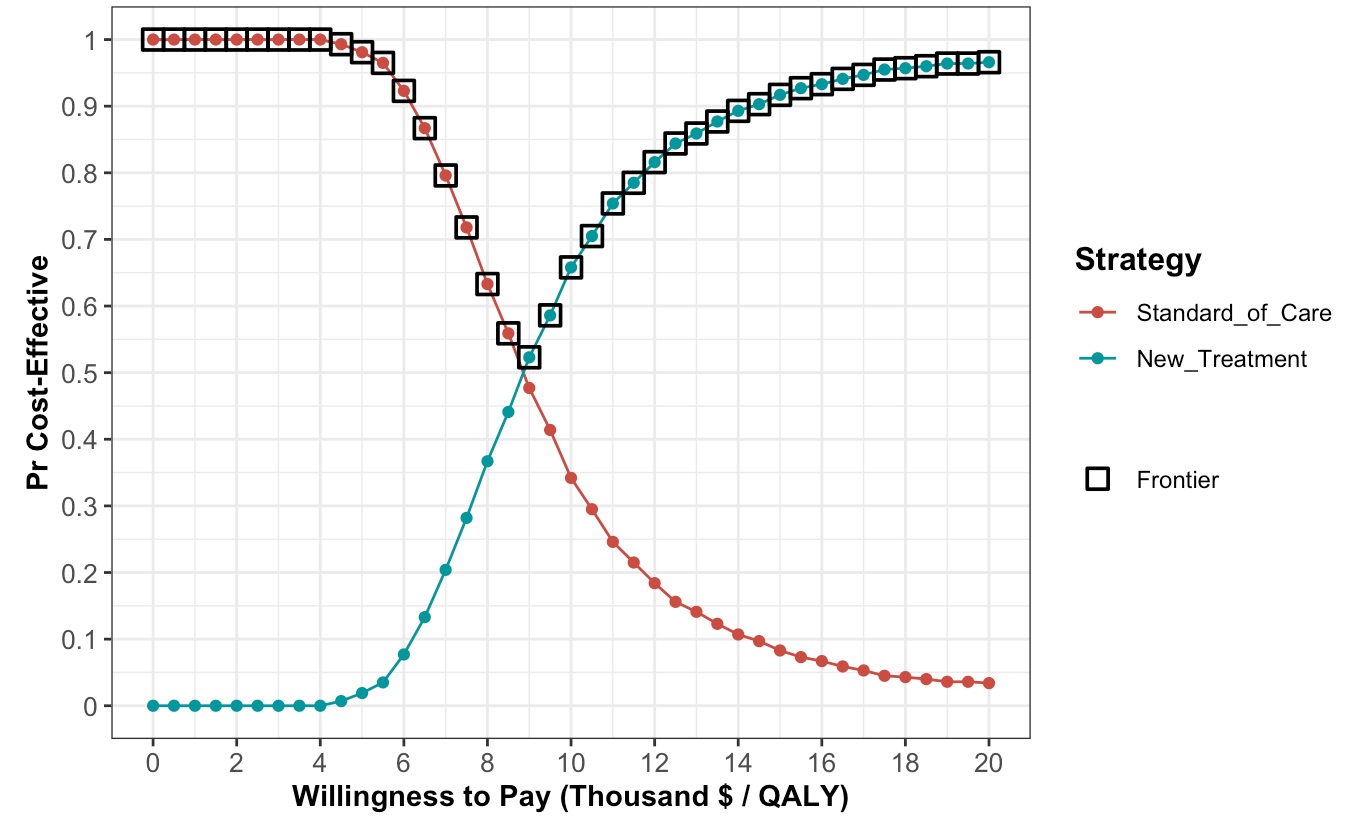
- The Cost-Effectiveness Acceptability Curve (CEAC)
If you want to adapt this to build your own two-strategy model, you can download the code for the WXYZ model or fork it from GitHub. You will need to do the following steps:
- update the names of your health states in Part 2
- re-write ‘functions_WXYZ.R’ to your model’s specifications - its parameters, its transition probability matrix, etc.
- update the starting row of the Markov trace matrix in Part 4
As always, e-mail me if you run into problems and I’ll do what I can to fix it right away. I would also love to hear your thoughts/feedback in the comments. Do you have a different approach? Is this your first R model? Did you use WXYZ for something in particular? Drop a note below.